The primary goal of the breeding atlas was to obtain a list of all birds that nest in each block. This required both identifying as many species as possible, and obtaining the strongest evidence for breeding as possible. In practice, it is unlikely that every species was found in most cases, but most of the resulting block lists should be fairly comprehensive. Most data were collected by volunteer birders, with many volunteers signing up to take primary responsibility for surveying one or two (occasionally more) blocks, and others augmenting those efforts by submitting checklists wherever they went birding.
Survey methods
Volunteers did not follow a detailed survey protocol and were simply tasked with compiling a list of birds they detected during each block visit, and assigning standard breeding codes to each species found. These lists were compiled to produce the final block lists, with the breeding code that provides the strongest evidence of breeding assigned to each species in the final lists.
To ensure that as many species as possible were found, we asked volunteers to aim for 20 hours of breeding-season survey work in each block. Results from other atlas projects suggest that this level of effort is likely to capture most species, and our own data show diminishing returns beyond this number of hours.
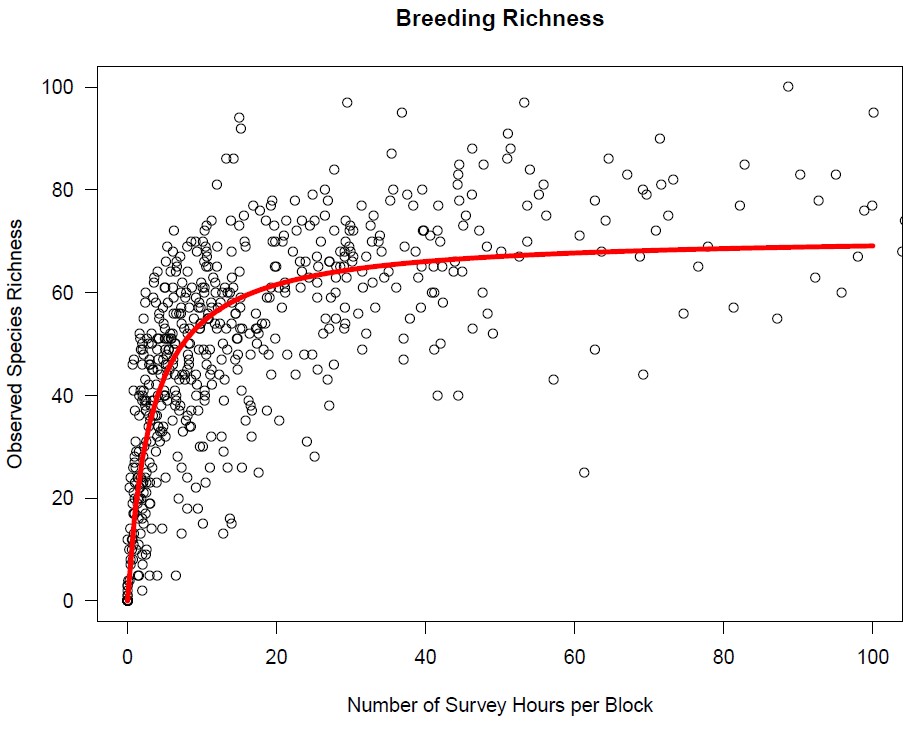
Graph showing the relationship between the number of species found in a block and the number of breeding-season survey hours, based on data available in December 2019 after two summers of data collection. These results were used to confirm our initial assumption that additional survey effort provided diminishing returns once a block had received 20 hours of survey time.
Spreading the 20 hours over multiple years was typical, and we encouraged people to distribute their survey effort over the course of the breeding season, as the timing of nesting varies among species. In particular, we emphasized the value of visits during the latter half of the summer when evidence of confirmed breeding – especially adults carrying food and recently fledged young – would be most likely. We encouraged observers to do the bulk of their surveys during the morning when most birds are most active, but also asked them to make at least one trip in the evening or at night to listen for owls and other nocturnal species.
Time spent during dedicated atlas surveys was reported by volunteers along with their survey checklists, and was summed across all checklists submitted for a block. These numbers will often underestimate the total time spent in a block because incidental observations were generally submitted without time estimates. Quantifying time spent gathering incidental observations is effectively impossible without requiring people to track every minute they spend in a block, whether birding or not – which is clearly impractical. Consequently, estimates of survey effort should be viewed as minima, and interpreted judiciously.
In addition to spreading out search effort over time, we asked volunteers to think about ways to gain good spatial coverage of their block. Although we did not emphasize the need to visit the entire area of the block, especially if the land cover was relatively uniform (e.g., continuous second growth forest, or large developed areas) or dominated by private land with limited access, we did ask volunteers to try to visit every habitat type present, in order to maximize the number of species found.
Block completion
Although we did not limit the amount of survey effort in a block, we did provide volunteers with guidance on when to consider work in a block to be complete. We used three quantitative criteria and recommended that once all three had been met, atlasing effort should be directed elsewhere. First, we measured progress towards our goal of obtaining 20 hours of survey time in a block. Second, we tracked the number of species found in block. And, third, we determined the proportion of detected species that had been confirmed as breeders.
Since a goal of the atlas project was to determine which species were found where, we did not know in advance how many species to expect in each block. In setting block targets, therefore, we assumed that the current number would be somewhat related to the number detected during the first breeding atlas and benchmarked the target to those numbers. This method is obviously imperfect, both because the initial surveys are unlikely to have obtained complete lists and because changes in species abundance would be expected to alter the number of species in each block. Although we could not fully address these problems, we do know that there have been substantial declines in North American bird populations over the past few decades, and the current survey was conducted over fewer years than the first atlas. Consequently, we set a goal of finding at least 80% of the number of species found during the 1980s.
We lacked objective criteria for how many confirmed breeding species to expect in each block as well. We do know that it is much harder to confirm breeding in a species, than to simply find the species in suitable breeding habitat, however, so we set the completion goal at 50% of the species found. Clearly, all three of our benchmarks are somewhat arbitrary, but collectively we decided that they would ensure that a block had received sufficient field work, appropriately spread out across time and space, to ensure representative information about the birds that are found there.
Finally, to convert these three metrics into a simple decision about whether continued work in a block was warranted, we combined the three numbers. To do this, we simply estimated how close we were to meeting each criterion – 20 hours of survey effort, 80% of the species found during the 1980s atlas, and at least 50% of detected species confirmed – and determined the average. During the final year of data collected, we posted regular updates of these numbers for each block in order to help volunteers decide how to most efficiently use their atlasing time.
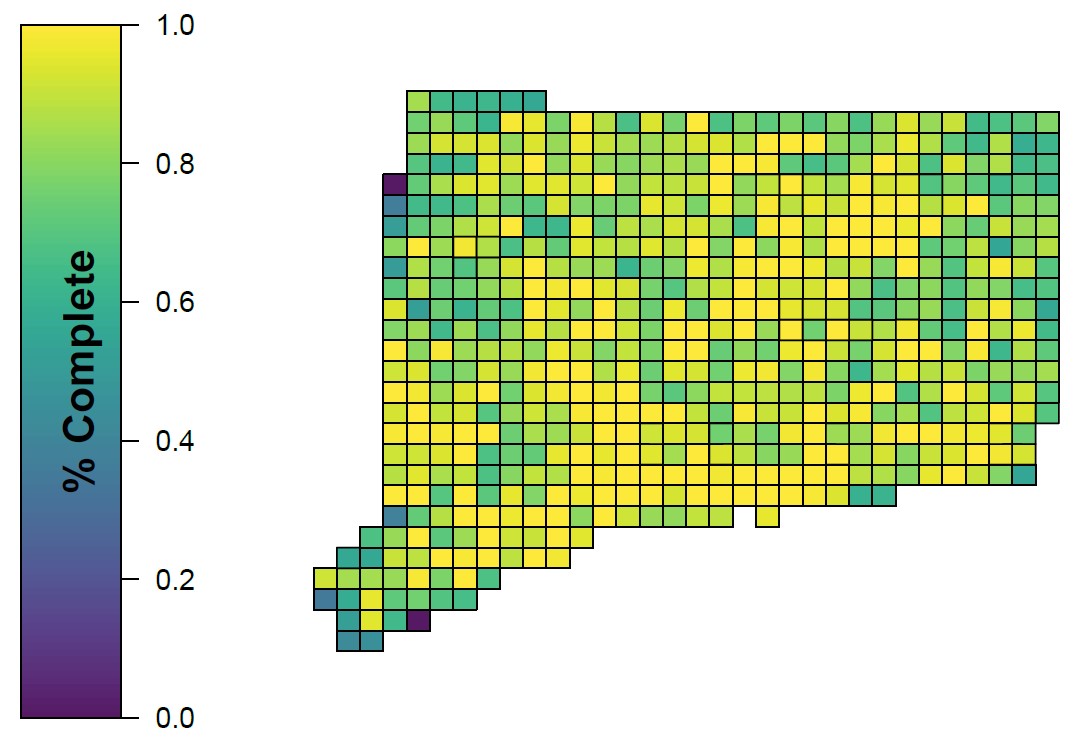
Map of Connecticut showing percent block completion for the breeding atlas, as of July 2021.
Data submission
Data were submitted in a variety of ways. Volunteers were encouraged to submit eBird checklists with their observations and to then share those with an eBird account that was set up for the atlas project. We also provided downloadable data sheets for use by observers who did not want to use eBird. Completed data sheets were then submitted on paper by mail, or electronically by email. A small minority of atlas volunteers submitted data via a variety of other means (excel spreadsheets, email communications, etc.). All datasheets submitted on paper were scanned and added to a digital archive that includes datasheets submitted via email. Paper originals are also archived at the University of Connecticut.
Most of the data that were not submitted directly into eBird by the observers were entered by the atlas team using the atlas eBird account to make the data available for other research uses. For rare cases, where privacy was a concern, we added data directly to the final atlas database without entering it into eBird.
Other data sources
To generate final block lists and maps, we augmented the volunteer-collected data using additional information, and conducted a series of data verification checks. Supplemental data came from a variety of sources. First, all of the data that were collected by atlas field technicians, as part of our standardized surveys to estimate abundance, were added. Although these surveys focused mostly on quantifying species abundance, technicians were asked to provide breeding codes for the species they found.
Second, data from a variety of surveys coordinated by the Connecticut Department of Energy and Environmental Protection, were added. These surveys included various coastal waterbirds, several waterfowl species, and several birds of prey, and are generally referred to in the written accounts for the focal species.
Third, data from conservation research projects run by other investigators were included. For example, records from long-term research on box-nesting American Kestrels, other uncommon raptors and owls, and saltmarsh-specialist breeders, were added to the atlas database.
Although USGS Breeding Bird Survey data were used to inform the written atlas accounts, they are not generally georeferenced at the point level, making them hard to assign to specific atlas blocks. Consequently, these data were used only when individual observers submitted them directly to the atlas with exact locations and associated breeding codes.
We also did not use a complete download of all eBird data because we did not want to include records that were submitted to eBird by people who were not following atlas protocols. Since most eBird submissions that were not related directly to the atlas did not include breeding codes, their inclusion would have made little difference to the block maps and lists anyway. While writing species accounts, however, we did review the larger eBird database to ensure that we were not missing particularly notable records, especially those for species that are rare or geographically restricted in the state. When we found well-documented records that added to our broad understanding of a species’ distribution in the state, we added them as incidental observations to the atlas database so that they would be reflected in the final species accounts.
Data verification
Data verification involved two main phases. During atlas data collection, individual checklists were screened more-or-less as they were submitted. Due to logistical constraints, this initial screening was relatively quick and not comprehensive, but it allowed us to follow-up with observers quickly when potentially erroneous records were found. Perhaps most important, it helped us to identify common errors and write targeted blog posts to explain data collection problems to atlas volunteers. During this period, we also posted regular online updates of the species lists for each block and asked volunteers and others with knowledge of a given area to review these lists and inform us of likely omissions and possible errors. Most reported errors involved observations that had been applied to the wrong atlas block because the location assigned to the submitted eBird checklist fell in an adjacent block.
In addition to direct screening of individual checklists, we systematically reviewed all records in the atlas database to identify breeding codes that had been used incorrectly. This review used methods developed for other atlases (provided to us by coordinators of the ongoing 3rd New York State Breeding Bird Atlas, but drawing on efforts by several other atlas projects), and was based on a comprehensive list of which codes are applicable to which species.
When a breeding code was used inappropriately, it was automatically changed to the most appropriate alternative. For example, if the S breeding code was applied to a Mallard it was changed because ducks do not sing. Because use of the S code requires that the bird be present in suitable breeding habitat, in this case the breeding code would have been changed to H. Since both S and H indicate Possible breeding, this change would not alter the maps, but it would have changed other data products, such as the breeding phenology graphs provided in the species accounts.
Other changes would have had more substantive effects. For example, the CF breeding code should not be used for certain species (e.g., ducks, most shorebirds, cowbirds) because they do not carry food for young, or for those (e.g., terns, raptors, kingfishers) that regularly carry food for their own consumption or from sites far enough from where they nest that they may be seen in a different block. For these species, CF codes would have been changed to H under the assumption that the species was observed in suitable breeding habitat.
Data were also screened by date to ensure that records were really indicative of local nesting. For information about this process see the page on breeding safe dates.
In general, we did not exclude submissions unless they involved exceptionally unusual circumstances (e.g., species far from known breeding areas, in blocks without known breeding habitat, etc.) and lacked supporting evidence. Surprising, but unverified, submissions are often identified in the species accounts, however, and are typically referred to as “reports”, rather than “records”. In rare cases involving species of high conservation concern, records are described in the accounts but not mapped to reduce the risk of disturbance.
UPDATES TO COME:
REPLACE FIGURES BASED ON FINAL PROOFED DATA.
[ADD TEXT ON DISTRIBUTION OF TIME EFFORT – graph of survey time per month/year]
[INSERT MAP SHOWING NUMBER OF HOURS/BLOCK]
[INSERT MAP SHOWING NUMBER OF SPECIES/BLOCK]
[INSERT MAP SHOWING NUMBER OF CONFIRMS/BLOCK]
[INSERT MAP SHOWING PERCENT CONFIRMS/BLOCK]
[INSECT FIGURE SHOWING CONFIRMATIONS RELATIVE TO HOURS BY BLOCK – maybe insert a paragraph or so higher in text …]
Spatial issues with checklist locations